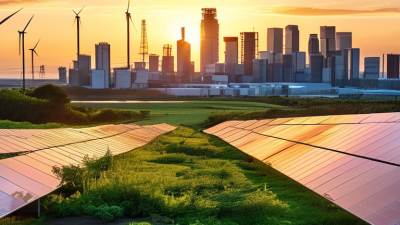
Top 10 Types of Clean Green Energy Solutions for Buyers
Choosing among clean green energy solutions requires more than comparing attractive brochures. Buyers must examine performance, cost, maintenance, environmental impact, and local suitability. A rooftop solar system may work brilliantly in a sunny suburb, while a small wind turbine may struggle near tall buildings. The choice is rarely simple.
This guide introduces ten practical energy options, including solar, wind, hydropower, geothermal, biomass, and emerging storage technologies. Each solution offers different benefits and limitations. Solar panels can reduce daytime grid demand, but output falls during cloudy weather. Heat pumps can improve household efficiency, yet installation quality strongly affects results. These details matter.
Reliable decisions should use manufacturer data, independent testing, energy audits, and qualified installers. Buyers should also review warranties, expected service life, recycling plans, and local regulations. A low purchase price may hide replacement costs or difficult maintenance. Measure carefully. Real projects often perform differently from predictions.
The recommendations in this guide reflect established engineering principles and practical buyer considerations. However, no universal ranking can fit every building, climate, budget, or community. Some data may change as technology improves. That uncertainty deserves honest attention. By comparing complete system costs and verified performance, buyers can select clean green energy solutions with greater confidence and fewer unpleasant surprises.
What Clean Green Energy Solutions Are and How They Work
Clean Green Energy Solutions: What They Are and How They Work
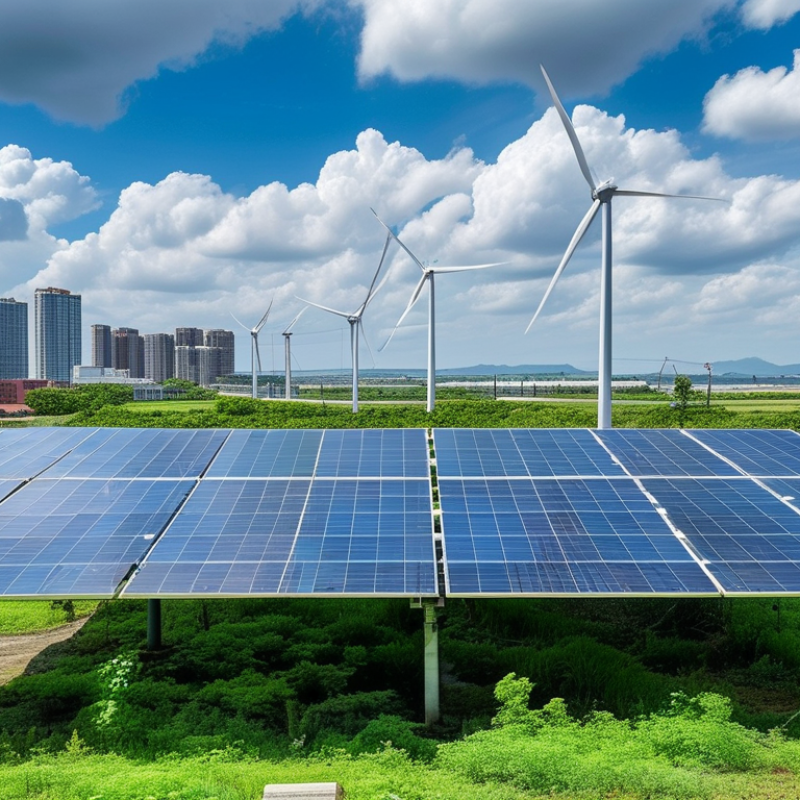
Clean green energy solutions produce power or useful heat with far fewer greenhouse-gas emissions than fossil fuels. Solar photovoltaic panels convert sunlight directly into electricity. Solar thermal systems collect heat for water or buildings. Wind turbines use moving air to spin generators, while hydropower uses flowing water. Geothermal systems draw heat from underground reservoirs. Biomass and biogas use organic material, although poor sourcing can reduce their environmental value. The categories overlap.
Other solutions work differently. Tidal and wave systems capture ocean movement, but their costs and ecological impacts still require careful review. Green hydrogen uses renewable electricity to split water into hydrogen and oxygen. It can support heavy transport or industrial heat, but storage remains difficult. Batteries store surplus electricity and release it during demand peaks. Heat pumps move existing heat rather than create it directly, often reducing building energy use.
Scale is changing quickly. The International Energy Agency reported 507 gigawatts of renewable capacity additions in 2023, nearly half of global additions. The International Renewable Energy Agency reported that renewables represented 86% of new global power capacity that year. These figures show momentum, not guaranteed performance. A buyer still needs site-specific wind, sunlight, grid, water, and maintenance data. Real projects can underperform. That uncomfortable possibility deserves attention.
Top 10 Types of Clean Green Energy Solutions for Buyers
Clean green energy solutions generate power with low or zero direct fossil-fuel use. The chart compares representative annual capacity factors, showing the approximate share of a year that each technology can produce electricity under suitable operating conditions.
Capacity factors are representative planning values based on commonly reported operating ranges. Actual performance varies with location, resource quality, technology design, maintenance, and grid availability.
Solar and Wind Systems for Generating Renewable Electricity
Top 10 Types of Clean Green Energy Solutions for Buyers
Solar photovoltaic and wind systems offer practical ways to generate renewable electricity on site. Solar panels convert daylight into power, while turbines capture moving air through rotating blades. According to IRENA’s Renewable Capacity Statistics 2024, global solar capacity reached about 1,419 gigawatts in 2023. Wind capacity exceeded 1,000 gigawatts worldwide. These figures show scale, not guaranteed savings.
A buyer should inspect roof direction, shading, structural strength, and local grid rules before purchasing solar equipment. A south-facing roof often performs well in the northern hemisphere, but nearby trees can reduce output sharply. Battery storage can shift daytime solar power into evening use. Measure the wind. Small details matter. Wind projects need reliable speed data at the planned hub height, plus checks for turbulence, noise, access, and maintenance. The Global Wind Report 2024 recorded approximately 117 gigawatts of new wind installations during 2023. However, a windy-looking site may still produce weak results.
The International Energy Agency reported that renewables added roughly 510 gigawatts of global capacity in 2023, with solar providing most of that growth. Buyers should compare estimated annual generation, equipment warranties, inverter replacement costs, and installer experience. Payback calculations can become misleading when they ignore winter output or battery degradation. I would also question unusually optimistic forecasts. Real roofs, changing weather, and imperfect maintenance rarely match a spreadsheet.
| Rank | Clean Energy Solution | Primary Energy Source | How It Generates Electricity | Typical Project Scale | Indicative Capacity Factor | Typical Lifecycle Emissions | Best-Fit Applications | Key Buyer Considerations |
|---|---|---|---|---|---|---|---|---|
| 1 | Solar Photovoltaic Systems | Sunlight | Semiconductor cells convert sunlight directly into direct current, which an inverter converts into alternating current. | 1 kW–500+ MW | 10%–30% | Approximately 20–50 g CO₂e/kWh | Homes, commercial rooftops, community solar, utility-scale power plants and off-grid systems. | Check solar resource, roof or land availability, shading, inverter life, storage needs, grid connection and end-of-life recycling plans. |
| 2 | Onshore Wind Systems | Wind movement | Wind rotates turbine blades connected to a generator, producing electricity through electromagnetic induction. | 100 kW–500+ MW | 25%–50% | Approximately 7–20 g CO₂e/kWh | Utility-scale generation, rural energy projects and areas with consistent wind resources. | Evaluate average wind speed, turbulence, setback distances, wildlife impacts, noise, transportation access and transmission capacity. |
| 3 | Offshore Wind Systems | Marine wind movement | Large turbines installed in coastal waters convert stronger and more consistent offshore winds into electricity. | 50 MW–2+ GW | 35%–60% | Approximately 8–25 g CO₂e/kWh | Large-scale power supply for coastal regions and densely populated electricity markets. | Consider water depth, seabed conditions, port infrastructure, marine construction, subsea cables, maintenance access and permitting. |
| 4 | Hydropower Systems | Flowing or falling water | Water turns turbines connected to generators. Reservoirs can also provide dispatchable electricity and energy storage. | 10 kW–10+ GW | 30%–60% | Approximately 4–100+ g CO₂e/kWh, site dependent | Reliable grid electricity, rural electrification, pumped storage and systems requiring flexible generation. | Assess water availability, drought risk, ecological effects, sedimentation, resettlement issues, dam safety and seasonal output. |
| 5 | Geothermal Power Systems | Earth’s internal heat | Hot water or steam from underground reservoirs drives turbines or heats a secondary working fluid in binary-cycle systems. | 1 MW–500+ MW | 70%–95% | Approximately 20–50 g CO₂e/kWh | Continuous baseload or flexible electricity in regions with suitable geothermal resources. | Require detailed geological surveys, exploration drilling, water management, induced-seismicity controls and long-term reservoir monitoring. |
| 6 | Concentrated Solar Power | Sunlight and thermal energy | Mirrors concentrate sunlight to heat a fluid, producing steam for a turbine; thermal storage can extend generation after sunset. | 10 MW–500+ MW | 20%–40% | Approximately 20–40 g CO₂e/kWh | High-direct-normal-irradiance regions requiring dispatchable renewable electricity. | Consider direct sunlight levels, land area, water availability, thermal-storage duration, dust management and construction complexity. |
| 7 | Sustainable Biomass and Biogas Power | Organic matter and biogenic waste | Biomass or cleaned biogas is combusted in engines, boilers or turbines to produce electricity and sometimes useful heat. | 100 kW–300+ MW | 50%–85% | Approximately 20–230 g CO₂e/kWh, feedstock dependent | Combined heat and power, agricultural sites, wastewater facilities, landfill-gas recovery and dispatchable renewable generation. | Verify sustainable feedstock supply, transport distance, air-emissions controls, methane leakage, competing land uses and local permits. |
| 8 | Tidal Stream Power | Ocean tides and marine currents | Underwater turbines use predictable tidal currents to rotate generators and produce electricity. | 100 kW–100+ MW | 20%–40% | Approximately 15–40 g CO₂e/kWh | Coastal or island grids with strong tidal currents and suitable marine infrastructure. | Review tidal velocity, corrosion protection, marine navigation, ecological monitoring, subsea cabling and specialized maintenance requirements. |
| 9 | Wave Energy Systems | Ocean waves | Floating or seabed-mounted devices capture wave motion and convert it into mechanical and electrical energy. | 10 kW–100+ MW | 20%–40% | Approximately 15–50 g CO₂e/kWh, technology dependent | Remote coastal communities, island grids and marine-energy demonstration or commercial projects. | Assess wave climate, storm survivability, mooring systems, marine maintenance, grid connection and technology performance history. |
| 10 | Renewable-Powered Green Hydrogen and Fuel Cells | Renewable electricity, water and hydrogen | Renewable electricity powers electrolysis to produce hydrogen; a fuel cell later converts the hydrogen back into electricity when needed. | 10 kW–1+ GW | System dependent; commonly 10%–50% | Approximately 20–60 g CO₂e/kWh when powered by low-carbon electricity | Long-duration or seasonal energy storage, backup power, remote microgrids and sectors needing clean dispatchable electricity. | Account for round-trip efficiency, water quality, hydrogen storage, safety systems, compression, leakage, utilization rate and renewable electricity sourcing. |
Hydropower, Geothermal, and Ocean Energy Technologies
Clean energy buyers are looking beyond familiar solar and wind projects. Hydropower, geothermal, and ocean technologies offer steadier output, but each depends on local conditions. A river site may provide predictable electricity through the night. It may also face seasonal droughts, fish migration concerns, and expensive civil works. Small details matter. Buyers should review flow records, turbine efficiency, grid distance, and maintenance access before signing a contract.
Geothermal systems draw heat from underground reservoirs or shallow ground loops. Deep projects can deliver reliable baseload power, while heat pumps can reduce building energy use. Test drilling, reservoir chemistry, and well decline rates deserve careful review. A technically attractive site can disappoint if drilling costs rise or the reservoir cools faster than expected. That risk is easy to underestimate. Even careful estimates can be wrong.
Ocean energy includes tidal stream, wave, and ocean thermal systems. Tidal devices benefit from measurable currents, yet saltwater corrosion, storms, and difficult repairs increase operating costs. Wave technology remains promising, but performance data may be limited across seasons. Buyers should request independent yield studies, insurance assumptions, decommissioning plans, and evidence from comparable installations. No option is flawless. A cautious decision may feel slower, but weak data should not be treated as certainty.
Biomass, Biogas, Hydrogen, and Fuel Cell Solutions
For buyers comparing clean green energy solutions, biomass and biogas deserve practical attention. Biomass systems use crop residues, wood waste, or dedicated organic materials as fuel. Their value depends on moisture, transport distance, and sustainable sourcing. Wet feedstock can reduce boiler efficiency and increase handling costs. In field assessments, a simple feedstock audit often reveals more than a polished performance estimate. Local farms, food processors, and wastewater facilities may provide steady supplies. However, contracts should address seasonal volumes, contamination, storage, and emissions monitoring. Biogas comes from controlled digestion of manure, food waste, or sewage sludge. It can support heating, electricity generation, or upgraded renewable gas. Digestate may benefit soil, but nutrient testing and responsible application remain essential. The system is not effortless.
Hydrogen is an energy carrier, not automatically a clean fuel. Its environmental value depends on production methods, electricity sources, compression, and transport. Buyers should request lifecycle emissions data and verify storage safeguards. Hydrogen fuel cells convert hydrogen into electricity through an electrochemical process. They produce very little local pollution, operate quietly, and can serve backup power, transport, or remote facilities. Proper ventilation, leak detection, trained maintenance, and compatible infrastructure are critical. Some project forecasts still look too neat. Real sites face weather changes, supply interruptions, and unfamiliar maintenance demands. A careful buyer should test performance assumptions against daily operating conditions, not only laboratory figures.
How Buyers Compare Costs, Efficiency, Maintenance, and Sustainability
Buyers need more than a low quoted price. Ten common options include solar photovoltaic, solar thermal, onshore wind, offshore wind, hydropower, geothermal, biomass, tidal, wave, and green hydrogen. Each serves different energy demands. IRENA’s Renewable Power Generation Costs in 2023 reported global weighted costs near $0.044 per kWh for utility-scale solar and $0.033 for onshore wind. These figures exclude grid upgrades, storage, land, financing, and permitting. That omission matters. Solar modules often convert about 20–23% of sunlight, while wind performance depends heavily on local conditions.
Geothermal and hydropower can provide dependable output, but drilling, water rights, and ecological risks increase project complexity. Offshore wind benefits from stronger marine resources, yet vessel access makes maintenance costly. Tidal and wave systems remain less mature, so reliable cost evidence is limited. Biomass can use agricultural residues, but transport distances and emissions require careful audits. Green hydrogen offers industrial flexibility and seasonal storage, though its efficiency falls sharply when electricity becomes hydrogen and then returns to power. Utilization matters greatly.
Sustainability requires lifecycle evidence, not only operating emissions. A 2022 UNECE report estimated median lifecycle emissions near 11 grams of CO2-equivalent per kWh for wind and 41 for solar photovoltaic systems. Results vary with manufacturing, materials, land use, and recycling. Buyers should price inspections, spare parts, downtime, degradation, and eventual replacement. A spreadsheet can still mislead. IRENA’s data also shows that cheaper generation may become expensive after grid connection and balancing costs. Personally, I would test seasonal output before trusting any efficiency claim.
Related Posts
-
Top 10 Energy Solutions for Sustainable Global Procurement?
-
Top 10 Renewable Power Solutions for Global Buyers
-

2026 Top Green Energy Renewable Solutions to Watch for the Future?
-
Top 10 Green Power Energy Solutions for a Sustainable Future?
-
Top Renewable Power Solutions Transforming the Energy Landscape Today?
-
10 Essential Tips for Implementing New Energy Solutions Successfully
CORPORATE HEADQUARTERS
North America
California
AGIC Energy North America LLC
13025 Danielson Street, Suite 105
Poway, CA 92064 – USA
Phone Number: +1 (858) 842 1513
Email: info@site_cc52bd27-560c-4f9d-bd66-63718fc42539
Sales: sales@site_cc52bd27-560c-4f9d-bd66-63718fc42539