Top 10 Renewable Power Solutions for Global Buyers
Global energy procurement is moving from ambition to measurable delivery. IRENA’s Renewable Capacity Statistics 2025 reports that renewables added approximately 585 gigawatts worldwide in 2024. They represented 92.5% of total new power capacity. The IEA’s Renewables 2024 report expects global renewable capacity to reach nearly 5,500 gigawatts by 2030. This growth creates opportunity, but it also increases pressure on buyers to compare technologies carefully.
This guide examines the Top 10 Renewable Power Solutions for Global Buyers. It considers solar photovoltaic systems, onshore and offshore wind, hydropower, geothermal energy, biomass, battery storage, and hybrid projects. Each option should be assessed beyond its advertised price. Buyers need to review energy yield, project bankability, grid compatibility, equipment warranties, operating conditions, and lifecycle emissions. Local service capacity matters too. A delayed replacement part can stop a remote project for weeks.
The best renewable power solutions are not always the cheapest on paper. A low bid may exclude transmission upgrades, land preparation, insurance, or battery replacement. The World Bank’s Global Solar Atlas and the Global Wind Atlas provide useful resource data, but site conditions still require professional validation. No ranking fits every market. Policy changes, currency risk, extreme weather, and weak grid infrastructure can reshape project economics.
The evidence is strong. The decisions remain difficult. This overview uses recognized industry reports and practical procurement criteria to support more reliable comparisons. It also leaves room for reconsideration, because renewable technologies and market conditions continue to change faster than many purchasing plans.
Frame the Top 10 Solutions with IRENA’s 2023 Renewable Capacity: 3,870 GW
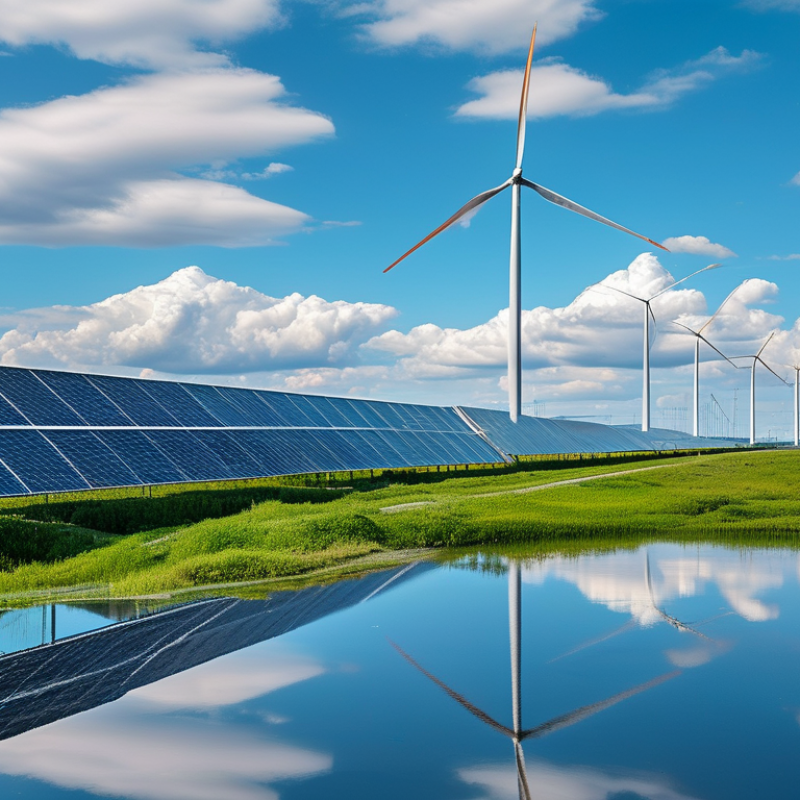
IRENA reported 3,870 GW of renewable capacity worldwide at the end of 2023. This figure gives global buyers a practical market reference. The top ten solutions include utility-scale solar PV, rooftop solar, onshore wind, offshore wind, hydropower, geothermal power, bioenergy, concentrated solar power, renewable microgrids, and renewable-plus-storage systems. Each option serves a different operating reality. Solar suits dry, open land. Wind needs reliable resource studies. Hydropower requires careful river and community assessments. Geothermal can provide steady output, but drilling risk remains significant.
Buyers should compare more than nameplate capacity. Review annual generation, grid connection distance, land conditions, water needs, maintenance access, and local permitting. A 100 MW project may produce very different results across regions. Site measurements matter. So does equipment durability in dust, salt air, heat, or freezing weather. Combining solar or wind with storage can reduce curtailment and improve evening supply, although batteries add cost, replacement planning, and safety requirements. Not every “green” solution fits every grid. That is easy to overlook.
Tips: Request measured resource data, not only estimates. Check the project’s capacity factor and outage history. Ask who will service the system after installation. Compare total lifetime cost, not purchase price alone. Leave room for uncertainty; forecasts can be wrong. A phased purchase may be wiser than a large commitment, especially where grid rules are changing. Use independent technical reviews before signing.
Classify Solar, Wind, Hydro, Geothermal, Biomass, Marine, Storage, and Hydrogen
Global buyers should classify renewable power by resource, reliability, and project conditions. Solar suits rooftops, deserts, and distributed facilities with strong daylight. Wind performs well along coastlines, plains, and elevated ridges. Hydropower provides steady output where rivers, reservoirs, and ecological safeguards align. Geothermal delivers dependable baseload energy, but drilling risk can be significant. Each category needs local resource data, not optimistic assumptions. Project reviews often reveal missed seasonal patterns. That oversight can be expensive.
Biomass converts agricultural residue, forestry waste, or organic by-products into controllable power. Its sustainability depends on responsible sourcing and transparent emissions accounting. Marine energy uses tides, waves, or currents, offering predictability but facing harsh saltwater conditions. Storage, including batteries and thermal systems, balances variable generation and supports evening demand. Hydrogen can store renewable energy for industry, transport, or long-duration applications. It requires substantial electricity, water planning, safe handling, and careful infrastructure design.
A professional procurement process compares capacity factors, grid connection costs, maintenance access, land use, and lifecycle impacts. Independent resource studies should verify supplier claims. Buyers also need clear performance guarantees, testing procedures, and repair timelines. Local permits and environmental assessments cannot be treated as paperwork alone. A solar site may look excellent until dust, weak transmission, or water scarcity changes the economics. Wind output may disappoint without accurate turbulence analysis. Even mature technologies have uncertain edges. That reality deserves honest pricing and flexible planning.
Compare Costs and Capacity Factors Using Lazard’s 2024 LCOE Data
Global buyers are comparing renewable power on more than headline price. The 2024 LCOE analysis places utility-scale solar near $29–$92 per megawatt-hour. Onshore wind ranges from roughly $27–$73 per megawatt-hour. These figures exclude many local grid upgrades, financing differences, and permitting delays.
Capacity factors change the practical value of each project. Recent international energy statistics commonly place solar photovoltaics around 15%–25% annually. Onshore wind often reaches 30%–45%, while offshore wind can approach 40%–55%. Geothermal projects may exceed 70%, offering steadier output but fewer suitable sites. Hydropower can provide flexible generation, although drought risk complicates long-term planning.
Costs are not destiny.
A 100-megawatt solar plant at a 20% capacity factor produces about 175 gigawatt-hours yearly. A similarly sized wind project at 40% produces about 350 gigawatt-hours. The comparison is useful, but imperfect. Land, transmission, storage, curtailment, and regional weather can overturn a simple LCOE ranking. The International Renewable Energy Agency reported continued cost reductions for solar and onshore wind through 2023, yet borrowing costs have weakened project economics. Buyers should test hourly output, not only average prices. A low-cost project can still disappoint when its electricity arrives after peak demand.
Top 10 Renewable Power Solutions for Global Buyers
Compare estimated unsubsidized LCOE ranges with typical capacity factors using 2024 renewable-energy benchmarks.
LCOE ranges are shown in 2024 USD per MWh and represent unsubsidized lifetime generation costs. Capacity factors are typical operating benchmarks and vary by site, resource quality, technology design, and grid conditions. Lower LCOE and higher capacity factor generally indicate stronger economics, but financing, transmission, storage, permitting, and land costs should also be evaluated.
Assess Grid Integration Against the IEA’s 2030 Renewable Growth Forecast
Top 10 Renewable Power Solutions for Global Buyers
Global buyers are assessing more than solar panels and wind turbines. They are comparing solar, onshore wind, offshore wind, hydropower, geothermal power, bioenergy, battery storage, green hydrogen, microgrids, and demand-response systems. The IEA’s 2030 forecast points to nearly 5,500 gigawatts of new renewable capacity worldwide. That scale will pressure transmission lines, balancing markets, and local grid operators. Generation alone is not enough. A strong project needs accurate resource studies, flexible inverters, forecasting software, and clear connection agreements. Grid integration often determines whether a low-cost asset performs reliably.
Tips: Test the grid early. Request hourly production data, not only annual estimates. Check curtailment rules, battery cycling limits, transformer capacity, and backup requirements. Visit comparable sites when possible. Small technical details matter.
Buyers should also examine how projects respond during cloudy afternoons, sudden wind drops, or voltage disturbances. Storage can shift output, while demand response can reduce peak stress. Modern control systems help, but they are not magic. Some projects still underestimate weak-grid conditions and permitting delays. That is a costly blind spot. The IEA forecast is ambitious, yet national networks may expand more slowly than renewable construction. A careful procurement plan therefore measures equipment quality, operational evidence, maintenance skills, and grid readiness together. Forecasts are not promises.
Select Regional Options by Reliability, Emissions, Finance, and Policy Metrics
Top 10 Renewable Power Solutions for Global Buyers
Regional selection should begin with reliability, not popularity. Offshore wind may deliver strong output in northern coastal markets, while utility-scale solar performs well across dry, high-irradiance regions. Hydropower can provide stable generation in mountain areas, but drought risk deserves serious review. Geothermal projects offer steady production where underground heat is accessible. Weather shifts. Storage can reduce hourly supply gaps, especially for solar and wind portfolios.
Emissions metrics should cover the full project life cycle, including construction, land use, transmission, and equipment replacement. A low operational footprint does not automatically mean a low total footprint. Buyers should request independently verified data and compare emissions per delivered megawatt-hour. Numbers can mislead. Local grid losses may change the result.
Finance and policy often decide whether a technically strong project succeeds. Compare contract duration, currency exposure, interest rates, curtailment rules, tax treatment, and grid-connection costs. A fixed-price agreement may improve budgeting, yet inflation can weaken its value over time. Policy stability matters more than attractive announcements. Buyers should examine permitting records, auction history, and payment enforcement before signing. Site visits, production records, and consultations with grid operators add practical confidence. Still, no regional ranking remains perfect; data quality varies, and political conditions can change faster than project models.
| Rank | Renewable Power Solution | Best-Fit Regional Options | Typical Capacity Factor | Reliability Profile | Lifecycle Emissions (g CO₂e/kWh) |
Indicative Global LCOE (2024 USD/MWh) |
Project Finance Profile | Policy and Market Readiness | Key Buyer Considerations |
|---|---|---|---|---|---|---|---|---|---|
| 1 | Onshore Wind Power | North America, Latin America, Northern Europe, Southern Africa, Australia, Central Asia | 35–50% | Variable output; highly predictable with modern forecasting. Benefits from geographic diversification and storage. | 7–11 | $27–73 | High maturity; commonly financed through long-term power purchase agreements, auctions, and merchant structures. | Strong auction and permitting frameworks in many markets; grid connection and local acceptance can determine delivery speed. | Excellent cost profile where wind resources and transmission capacity are strong; assess curtailment and land-use requirements. |
| 2 | Utility-Scale Solar Photovoltaic | Middle East, North Africa, Australia, India, Latin America, Southern Europe, Southwestern United States | 18–30% | Predictable daily profile but intermittent; pairing with batteries, flexible demand, or complementary generation improves firmness. | 20–50 | $29–92 | Very high maturity; scalable in small and large projects with strong lender familiarity and relatively short construction periods. | Broadly supported by auctions, tax mechanisms, net-zero targets, and corporate clean-energy procurement. | Low operating cost and rapid deployment; evaluate grid congestion, module recycling, water use for cleaning, and land availability. |
| 3 | Hydropower with Reservoir Storage | Mountainous and high-rainfall regions of Latin America, Asia, Africa, Canada, and Northern Europe | 30–60% | Highly dispatchable; reservoirs can provide capacity, balancing, black-start capability, and seasonal storage. | 4–48 | $39–154 | Mature technology but capital-intensive; financing depends heavily on concessions, hydrology, construction risk, and public-sector support. | Established in many countries, but new projects face rigorous environmental, social, resettlement, and water-governance requirements. | Strongest renewable option for system flexibility where suitable sites remain available; drought and climate variability require stress testing. |
| 4 | Geothermal Power | East African Rift, Indonesia, the Philippines, Japan, New Zealand, Iceland, Türkiye, Western North America, Central America | 70–90% | Firm, round-the-clock generation with high availability; output is generally independent of weather conditions. | 38–50 | $64–110 | Medium maturity; exploration and drilling create early-stage resource risk, while operating projects can generate stable cash flow. | Most attractive where resource mapping, drilling insurance, concessional finance, and clear subsurface rights are available. | Valuable for baseload and grid stability; confirm reservoir sustainability, seismic conditions, permitting, and drilling success rates. |
| 5 | Offshore Wind Power | North Sea, Baltic Sea, Atlantic and Pacific coasts, East Asia, and selected coastal areas of North America | 40–55% | Higher and steadier wind output than many onshore sites; still variable and dependent on marine weather and transmission availability. | 12–15 | $74–139 | High technical maturity but high capital intensity; requires robust auctions, indexed contracts, port infrastructure, and supply-chain capacity. | Strong strategic support in established offshore markets; seabed leasing, maritime planning, fisheries, and environmental approvals are critical. | Suitable for large coastal demand centers; assess vessel availability, corrosion, offshore grid design, and construction-cost inflation. |
| 6 | Distributed and Rooftop Solar PV | Urban and industrial areas with high solar irradiation, including South Asia, Southeast Asia, Southern Europe, Africa, Australia, and the Americas | 12–25% | Variable daytime generation distributed close to demand; batteries and demand response can improve resilience and self-consumption. | 20–50 | $45–140 | High technology maturity; financing is fragmented and depends on credit quality, installation standards, and customer payment structures. | Supported by net-metering, feed-in tariffs, tax credits, public procurement, and distributed-energy mandates, though rules can change quickly. | Reduces transmission losses and can improve energy access; verify roof condition, interconnection rules, fire safety, and battery requirements. |
| 7 | Bioenergy Power from Sustainable Residues | Agricultural and forestry regions in Europe, North America, Brazil, Southeast Asia, and selected African markets | 60–85% | Dispatchable when fuel is stored and supply contracts are secure; suitable for combined heat and power applications. | 50–230 | $87–221 | Medium maturity; bankability depends on long-term feedstock contracts, logistics, sustainability certification, and plant efficiency. | Eligibility increasingly depends on strict land-use, biodiversity, carbon-accounting, and air-quality rules. | Can provide firm renewable capacity, but buyers must verify feedstock origin, indirect land-use effects, methane leakage, and local air emissions. |
| 8 | Concentrated Solar Power with Thermal Storage | High-direct-normal-irradiance zones in North Africa, the Middle East, Chile, Southern Africa, Australia, Spain, and the southwestern United States | 40–60% | Dispatchable after sunset when thermal storage is included; can provide several hours of firm evening output and ancillary services. | 10–30 | $92–226 | Specialized finance profile; project economics require long-term capacity or energy contracts and strong construction expertise. | Most viable under capacity auctions, clean-firm-power programs, or contracts that value evening and dispatchable generation. | Offers solar energy plus storage without electrochemical batteries; water use, high direct sunlight, and construction complexity are important constraints. |
| 9 | Small and Run-of-River Hydropower | Mountain watersheds and river systems in South and Southeast Asia, Latin America, the Balkans, East Africa, and parts of China | 40–70% | Generally dependable but seasonal; run-of-river projects have limited storage and may experience low output during dry periods. | 4–48 | $50–200 | Medium to high maturity; smaller project size can simplify deployment but may increase unit costs and local financing needs. | Often supported by rural electrification programs and distributed-generation incentives; environmental-flow rules remain essential. | Useful for remote grids and local reliability; assess watershed changes, sedimentation, fish passage, community rights, and seasonal flows. |
| 10 | Tidal-Stream Power | High-current coastal channels in the United Kingdom, France, Canada, South Korea, Japan, and selected island systems | 30–45% | Highly predictable output because tidal cycles are known; generation remains intermittent and usually requires grid balancing. | 10–20 | $150–300+ early commercial range |
Emerging technology; demonstration and first-of-a-kind projects often require grants, public guarantees, or innovation contracts. | Best supported through marine-energy pilots, contracts for difference, innovation funds, and streamlined marine permitting. | Predictability is a major advantage, but buyers should allow for technology, subsea-maintenance, biofouling, and installation risks. |
Related Posts
-
China Best Green Power Energy Solutions for Global Buyers?
-

Top 10 Green Power Solutions for Sustainable Business Growth?
-

2026 Top Renewable Solutions for a Sustainable Future?
-

2026 Top Green Energy Renewable Solutions to Watch for the Future?
-

Top Renewable Power Solutions Transforming the Energy Landscape Today?
-

10 Essential Tips for Implementing New Energy Solutions Successfully
CORPORATE HEADQUARTERS
North America
California
AGIC Energy North America LLC
13025 Danielson Street, Suite 105
Poway, CA 92064 – USA
Phone Number: +1 (858) 842 1513
Email: info@site_cc52bd27-560c-4f9d-bd66-63718fc42539
Sales: sales@site_cc52bd27-560c-4f9d-bd66-63718fc42539